Regressão logística múltipla com interação entre variáveis explicativas quantitativas e qualitativas
Como acompanhamento deessa questão, Ajustei a regressão logística múltipla com interação entre variáveis explicativas quantitativas e qualitativas. MWE é dado abaixo:
Type <- rep(x=LETTERS[1:3], each=5)
Conc <- rep(x=seq(from=0, to=40, by=10), times=3)
Total <- 50
Kill <- c(10, 30, 40, 45, 38, 5, 25, 35, 40, 32, 0, 32, 38, 47, 40)
df <- data.frame(Type, Conc, Total, Kill)
fm1 <-
glm(
formula = Kill/Total~Type*Conc
, family = binomial(link="logit")
, data = df
, weights = Total
)
summary(fm1)
Call:
glm(formula = Kill/Total ~ Type * Conc, family = binomial(link = "logit"),
data = df, weights = Total)
Deviance Residuals:
Min 1Q Median 3Q Max
-4.871 -2.864 1.204 1.706 2.934
Coefficients:
Estimate Std. Error z value Pr(>|z|)
(Intercept) -0.65518 0.23557 -2.781 0.00541 **
TypeB -0.34686 0.33677 -1.030 0.30302
TypeC -0.66230 0.35419 -1.870 0.06149 .
Conc 0.07163 0.01152 6.218 5.04e-10 ***
TypeB:Conc -0.01013 0.01554 -0.652 0.51457
TypeC:Conc 0.03337 0.01788 1.866 0.06201 .
---
Signif. codes: 0 ‘***’ 0.001 ‘**’ 0.01 ‘*’ 0.05 ‘.’ 0.1 ‘ ’ 1
(Dispersion parameter for binomial family taken to be 1)
Null deviance: 277.092 on 14 degrees of freedom
Residual deviance: 96.201 on 9 degrees of freedom
AIC: 163.24
Number of Fisher Scoring iterations: 5
anova(object=fm1, test="LRT")
Analysis of Deviance Table
Model: binomial, link: logit
Response: Kill/Total
Terms added sequentially (first to last)
Df Deviance Resid. Df Resid. Dev Pr(>Chi)
NULL 14 277.092
Type 2 6.196 12 270.895 0.04513 *
Conc 1 167.684 11 103.211 < 2e-16 ***
Type:Conc 2 7.010 9 96.201 0.03005 *
---
Signif. codes: 0 ‘***’ 0.001 ‘**’ 0.01 ‘*’ 0.05 ‘.’ 0.1 ‘ ’ 1
df$Pred <- predict(object=fm1, data=df, type="response")
df1 <- with(data=df,
expand.grid(Type=levels(Type)
, Conc=seq(from=min(Conc), to=max(Conc), length=51)
)
)
df1$Pred <- predict(object=fm1, newdata=df1, type="response")
library(ggplot2)
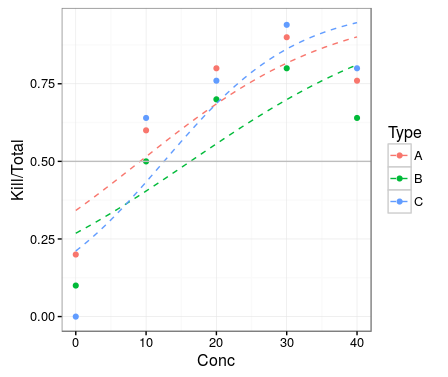
ggplot(data=df, mapping=aes(x=Conc, y=Kill/Total, color=Type)) + geom_point() +
geom_line(data=df1, mapping=aes(x=Conc, y=Pred), linetype=2) +
geom_hline(yintercept=0.5,col="gray")
Eu quero calcularLD50, LD90 eLD95 com seus intervalos de confiança. Como a interação é significativa, eu quero calcularLD50, LD90 eLD95 com seus intervalos de confiança para cadaType (A, B, and C) separadamente.
LD apoiadose letal. É a quantidade de substância necessária para matar X% (LD50 = 50%) da população em teste.
Editado Type é uma variável qualitativa que representa diferentes tipos de medicamentos eConc é uma variável quantitativa que representa diferentes concentrações de medicamentos.