Adicionar um gráfico de linhas abaixo de um gráfico de pizza existente
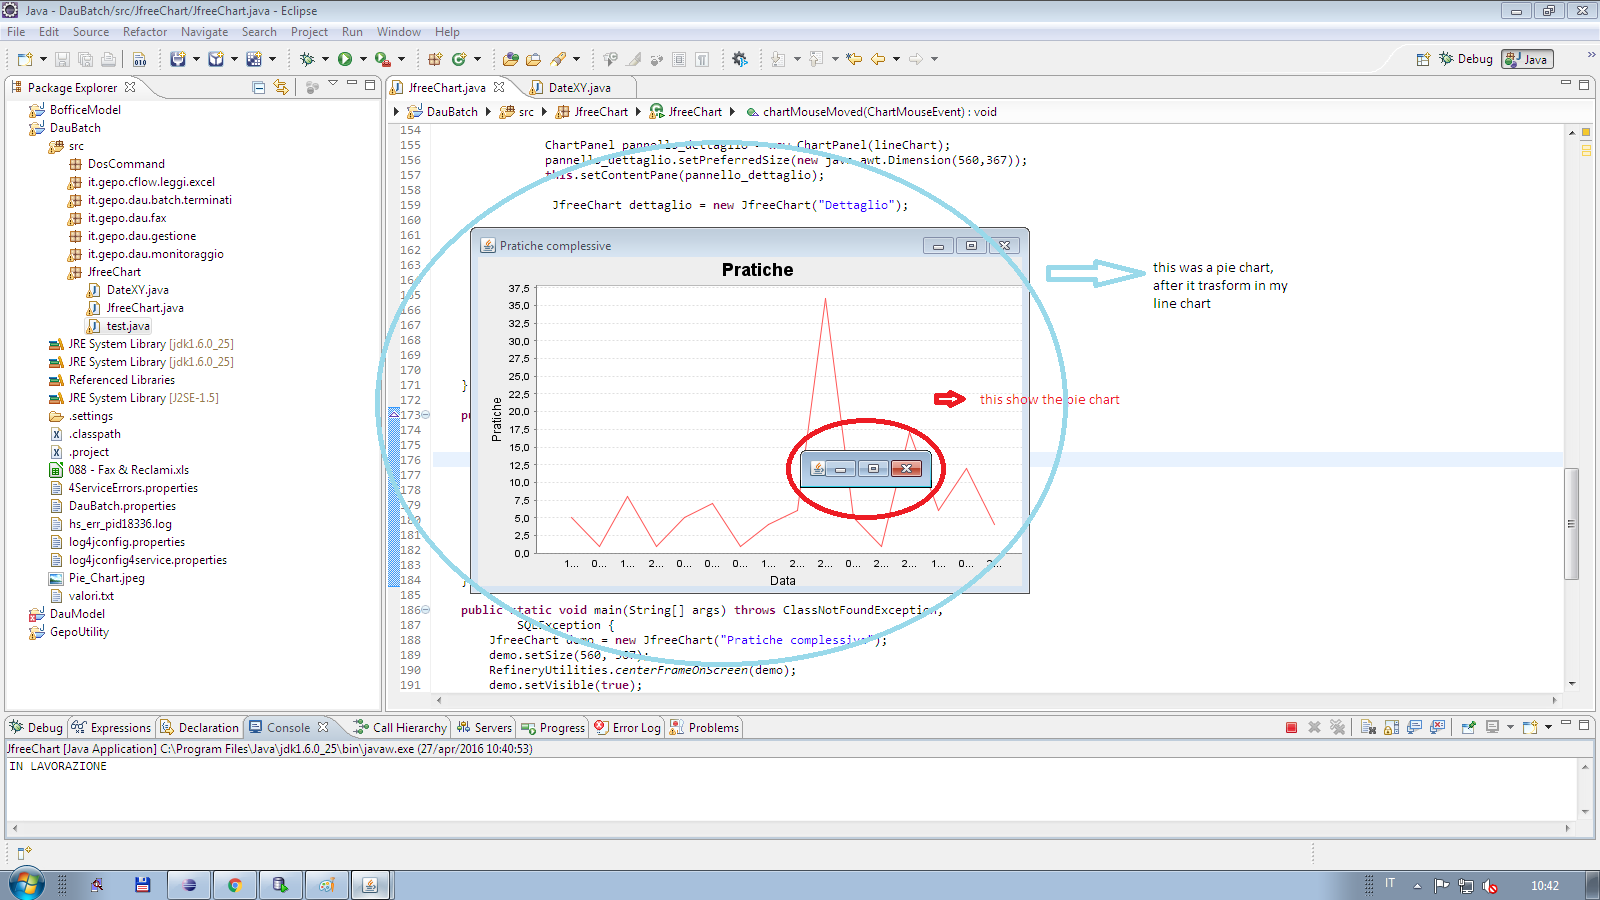
Quando clico em uma seção do gráfico de partes, gostaria de ver no primeiro gráfico outro gráfico (gráfico de linhas). Agora eu gere outro gráfico de painel, mas perdi o primeiro painel, porque o segundo gráfico pinta no primeiro painel e o segundo pinta um primeiro gráfico, mas o segundo tem uma dimensão ruim; veja a imagem.
Como posso ajustar meu problema?
JFreeChart chart = ChartFactory.createPieChart("Pratiche complessive",
            dataset, true, true, false);
    ChartPanel chartPanel = new ChartPanel(chart);
    chartPanel.setPreferredSize(new java.awt.Dimension(560, 370));
    PiePlot plot = (PiePlot) chart.getPlot();

    PieSectionLabelGenerator gen = new StandardPieSectionLabelGenerator(
            "{1} pratica/che");
    plot.setLabelFont(new Font("Courier New", Font.BOLD, 10));
    plot.setLabelLinkPaint(Color.BLACK);
    plot.setLabelLinkStroke(new BasicStroke(1.0f));
    plot.setLabelOutlineStroke(null);
    plot.setLabelPaint(Color.BLUE);
    plot.setLabelBackgroundPaint(null);
    plot.setLabelGenerator(gen);
    chart.setBackgroundPaint(Color.orange);
    chartPanel.addChartMouseListener(this);
    this.setContentPane(chartPanel);
}

public void chartMouseClicked(ChartMouseEvent event) {

    ChartEntity entity = event.getEntity();
    String sezione = "";
    sezione = entity.toString().substring(17);
    sezione = sezione.replace(")", "");
    System.out.println(sezione);
    // PieSection: 0, 0(ARCHIVIATO)===>ARCHIVIATO V
    if (entity != null) {

        try {
            String query = query;

            String numero_pratiche = "";
            String nome_stato = "";
            String data_modifica;

            stmt = conn.prepareStatement(query);
            rs = stmt.executeQuery();
            DefaultCategoryDataset dataset = new DefaultCategoryDataset();
            while (rs.next()) {
                dataset
            }
            // System.out.println(entity.toString());

            JFreeChart lineChart = ChartFactory.createLineChart("Pratiche", "Data", "Pratiche", dataset, PlotOrientation.VERTICAL,true, true, false);
            ChartPanel pannello_dettaglio = new ChartPanel(lineChart);
            pannello_dettaglio.setPreferredSize(new java.awt.Dimension(560,367));
            this.setContentPane(pannello_dettaglio);
             JfreeChart dettaglio = new JfreeChart("Dettaglio");
            pannello_dettaglio.setSize(560, 367);
            RefineryUtilities.centerFrameOnScreen(dettaglio);
            dettaglio.setVisible(true);

        } catch (Exception e) {
            e.printStackTrace();
        }
    }
}

//first panel(piechart)
    public static void main(String[] args) throws ClassNotFoundException,
            SQLException {
        JfreeChart demo = new JfreeChart("Pratiche complessive");
        demo.setSize(560, 367);
        RefineryUtilities.centerFrameOnScreen(demo);
        demo.setVisible(true);

    }
esta é minha primeira torta de gráfico:
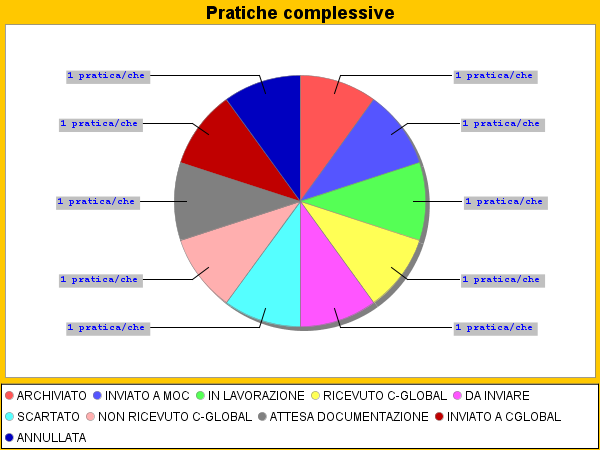
Este é o meu resultado final: