Agregar un gráfico de líneas debajo de un gráfico circular existente
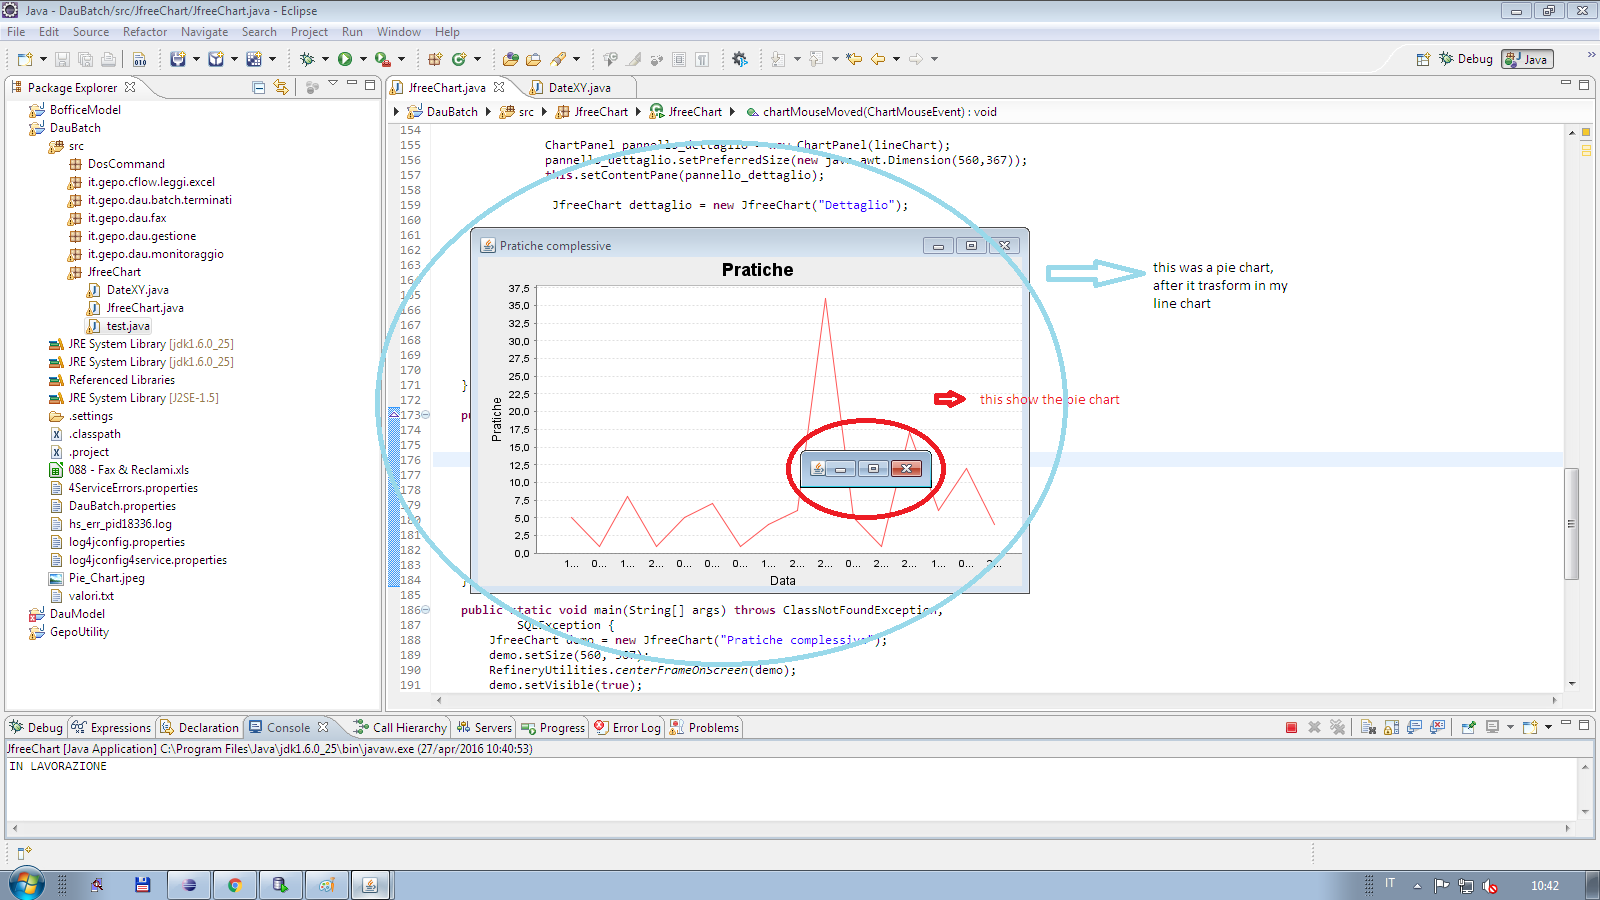
Cuando hago clic en una sección de mi gráfico circular, me gustaría ver debajo del primer gráfico otro gráfico (gráfico de líneas). Ahora generé otro gráfico de panel, pero perdí el primer panel, porque el segundo gráfico pinta en el primer panel y el segundo pinta un primer gráfico, pero el segundo tiene una mala dimensión; ver imagen
¿Cómo puedo ajustar mi problema?
JFreeChart chart = ChartFactory.createPieChart("Pratiche complessive",
            dataset, true, true, false);
    ChartPanel chartPanel = new ChartPanel(chart);
    chartPanel.setPreferredSize(new java.awt.Dimension(560, 370));
    PiePlot plot = (PiePlot) chart.getPlot();

    PieSectionLabelGenerator gen = new StandardPieSectionLabelGenerator(
            "{1} pratica/che");
    plot.setLabelFont(new Font("Courier New", Font.BOLD, 10));
    plot.setLabelLinkPaint(Color.BLACK);
    plot.setLabelLinkStroke(new BasicStroke(1.0f));
    plot.setLabelOutlineStroke(null);
    plot.setLabelPaint(Color.BLUE);
    plot.setLabelBackgroundPaint(null);
    plot.setLabelGenerator(gen);
    chart.setBackgroundPaint(Color.orange);
    chartPanel.addChartMouseListener(this);
    this.setContentPane(chartPanel);
}

public void chartMouseClicked(ChartMouseEvent event) {

    ChartEntity entity = event.getEntity();
    String sezione = "";
    sezione = entity.toString().substring(17);
    sezione = sezione.replace(")", "");
    System.out.println(sezione);
    // PieSection: 0, 0(ARCHIVIATO)===>ARCHIVIATO V
    if (entity != null) {

        try {
            String query = query;

            String numero_pratiche = "";
            String nome_stato = "";
            String data_modifica;

            stmt = conn.prepareStatement(query);
            rs = stmt.executeQuery();
            DefaultCategoryDataset dataset = new DefaultCategoryDataset();
            while (rs.next()) {
                dataset
            }
            // System.out.println(entity.toString());

            JFreeChart lineChart = ChartFactory.createLineChart("Pratiche", "Data", "Pratiche", dataset, PlotOrientation.VERTICAL,true, true, false);
            ChartPanel pannello_dettaglio = new ChartPanel(lineChart);
            pannello_dettaglio.setPreferredSize(new java.awt.Dimension(560,367));
            this.setContentPane(pannello_dettaglio);
             JfreeChart dettaglio = new JfreeChart("Dettaglio");
            pannello_dettaglio.setSize(560, 367);
            RefineryUtilities.centerFrameOnScreen(dettaglio);
            dettaglio.setVisible(true);

        } catch (Exception e) {
            e.printStackTrace();
        }
    }
}

//first panel(piechart)
    public static void main(String[] args) throws ClassNotFoundException,
            SQLException {
        JfreeChart demo = new JfreeChart("Pratiche complessive");
        demo.setSize(560, 367);
        RefineryUtilities.centerFrameOnScreen(demo);
        demo.setVisible(true);

    }
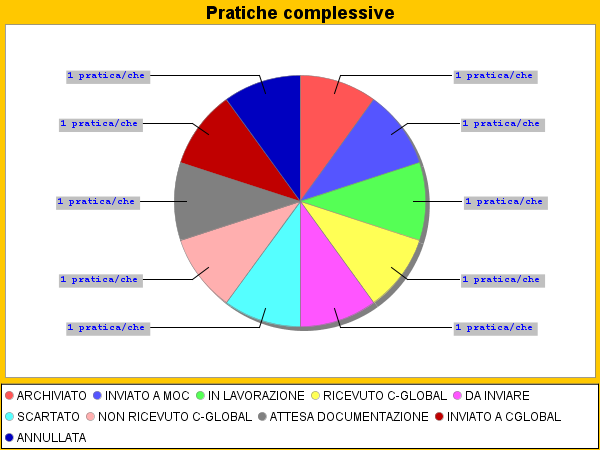
Este es mi primer pastel gráfico:
Este es mi resultado final: