Indicador D3, posiciones de valores de visualización
Estoy tratando de usar algunos javascript escritos para hacer el calibre. Ya casi estoy allí, pero no puedo entender cómo administrar los títulos de valor.
Así es como funciona mi código ahora:
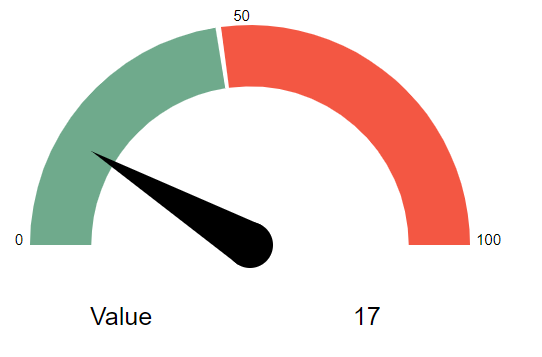
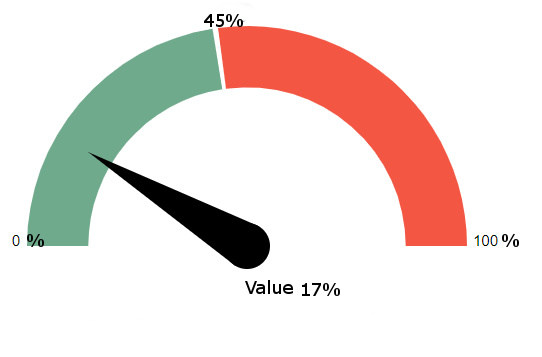
Y así es como me gusta que funcione:
No sé cómo abordar el problema. Trabajar con esos Math.Pi, Math.cos y Math.sin es demasiado para mí.
var name = "Value";

var value = 17;


var gaugeMaxValue = 100;

// data to calculate
var percentValue = value / gaugeMaxValue;

////////////////////////

var needleClient;


(function(){

var barWidth, chart, chartInset, degToRad, repaintGauge,
    height, margin, numSections, padRad, percToDeg, percToRad,
    percent, radius, sectionIndx, svg, totalPercent, width;


  percent = percentValue;

  numSections = 1;
  sectionPerc = 1 / numSections / 2;
  padRad = 0.025;
  chartInset = 10;

  // Orientation of gauge:
  totalPercent = .75;

  el = d3.select('.chart-gauge');

  margin = {
    top: 20,
    right: 20,
    bottom: 30,
    left: 20
  };

  width = el[0][0].offsetWidth - margin.left - margin.right;
  height = width;
  radius = Math.min(width, height) / 2;
  barWidth = 40 * width / 300;


  //Utility methods

  percToDeg = function(perc) {
    return perc * 360;
  };

  percToRad = function(perc) {
    return degToRad(percToDeg(perc));
  };

  degToRad = function(deg) {
    return deg * Math.PI / 180;
  };

  // Create SVG element
  svg = el.append('svg').attr('width', width + margin.left + margin.right).attr('height', height + margin.top + margin.bottom);

  // Add layer for the panel
  chart = svg.append('g').attr('transform', "translate(" + ((width + margin.left) / 2) + ", " + ((height + margin.top) / 2) + ")");


  chart.append('path').attr('class', "arc chart-first");
  chart.append('path').attr('class', "arc chart-second");
  chart.append('path').attr('class', "arc chart-third");
  formatValue = d3.format('1%');


  arc3 = d3.svg.arc().outerRadius(radius - chartInset).innerRadius(radius - chartInset - barWidth)
  arc2 = d3.svg.arc().outerRadius(radius - chartInset).innerRadius(radius - chartInset - barWidth)
  arc1 = d3.svg.arc().outerRadius(radius - chartInset).innerRadius(radius - chartInset - barWidth)

  repaintGauge = function ()
  {
    perc = 45/100;
    var next_start = totalPercent;
    arcStartRad = percToRad(next_start);
    arcEndRad = arcStartRad + percToRad(perc / 2);
    next_start += perc / 2;


    arc1.startAngle(arcStartRad).endAngle(arcEndRad);

    perc = 1-perc;
    arcStartRad = percToRad(next_start);
    arcEndRad = arcStartRad + percToRad(perc / 2);
    next_start += perc / 2;

    arc2.startAngle(arcStartRad + padRad).endAngle(arcEndRad);

    chart.select(".chart-first").attr('d', arc1);
    chart.select(".chart-second").attr('d', arc2);


  }
/////////

    var dataset = [{metric:name, value: value}]

    var texts = svg.selectAll("text")
                .data(dataset)
                .enter();

    texts.append("text")
         .text(function(){
              return dataset[0].metric;
         })
         .attr('id', "Name")
         .attr('transform', "translate(" + ((width + margin.left) / 6) + ", " + ((height + margin.top) / 1.5) + ")")
         .attr("font-size",25)
         .style("fill", "#000000");


    texts.append("text")
         .text(function(){
            return dataset[0].value;
         })
         .attr('id', "Value")
         .attr('transform', "translate(" + ((width + margin.left) / 1.4) + ", " + ((height + margin.top) / 1.5) + ")")
         .attr("font-size",25)
         .style("fill", "#000000");


    texts.append("text")
        .text(function(){
            return 0;
        })
        .attr('id', 'scale0')
        .attr('transform', "translate(" + ((width + margin.left) / 100 ) + ", " + ((height + margin.top) / 2) + ")")
        .attr("font-size", 15)
        .style("fill", "#000000");

    texts.append("text")
        .text(function(){
            return gaugeMaxValue/2;
        })
        .attr('id', 'scale10')
        .attr('transform', "translate(" + ((width + margin.left) / 2.15 ) + ", " + ((height + margin.top) / 30) + ")")
        .attr("font-size", 15)
        .style("fill", "#000000");


    texts.append("text")
        .text(function(){
            return gaugeMaxValue;
        })
        .attr('id', 'scale20')
        .attr('transform', "translate(" + ((width + margin.left) / 1.03 ) + ", " + ((height + margin.top) / 2) + ")")
        .attr("font-size", 15)
        .style("fill", "#000000");

  var Needle = (function() {

    //Helper function that returns the `d` value for moving the needle
    var recalcPointerPos = function(perc) {
      var centerX, centerY, leftX, leftY, rightX, rightY, thetaRad, topX, topY;
      thetaRad = percToRad(perc / 2);
      centerX = 0;
      centerY = 0;
      topX = centerX - this.len * Math.cos(thetaRad);
      topY = centerY - this.len * Math.sin(thetaRad);
      leftX = centerX - this.radius * Math.cos(thetaRad - Math.PI / 2);
      leftY = centerY - this.radius * Math.sin(thetaRad - Math.PI / 2);
      rightX = centerX - this.radius * Math.cos(thetaRad + Math.PI / 2);
      rightY = centerY - this.radius * Math.sin(thetaRad + Math.PI / 2);
      return "M " + leftX + " " + leftY + " L " + topX + " " + topY + " L " + rightX + " " + rightY;
    };

    function Needle(el) {
      this.el = el;
      this.len = width / 2.5;
      this.radius = this.len / 8;
    }

    Needle.prototype.render = function() {
      this.el.append('circle').attr('class', 'needle-center').attr('cx', 0).attr('cy', 0).attr('r', this.radius);

      return this.el.append('path').attr('class', 'needle').attr('id', 'client-needle').attr('d', recalcPointerPos.call(this, 0));


    };

    Needle.prototype.moveTo = function(perc) {
      var self,
          oldValue = this.perc || 0;

      this.perc = perc;
      self = this;

      // Reset pointer position
      this.el.transition().delay(100).ease('quad').duration(200).select('.needle').tween('reset-progress', function() {
        return function(percentOfPercent) {
          var progress = (1 - percentOfPercent) * oldValue;

          repaintGauge(progress);
          return d3.select(this).attr('d', recalcPointerPos.call(self, progress));
        };
      });

      this.el.transition().delay(300).ease('bounce').duration(1500).select('.needle').tween('progress', function() {
        return function(percentOfPercent) {
          var progress = percentOfPercent * perc;

          repaintGauge(progress);
          return d3.select(this).attr('d', recalcPointerPos.call(self, progress));
        };
      });

    };


    return Needle;

  })();


  needle = new Needle(chart);
  needle.render();
  needle.moveTo(percent);

})();
<style type="text/css" src="gauge.css">
.chart-gauge
{
width: 400px;
margin: 100px auto
}
.chart-first
{
fill: #66AB8C;
}
.chart-second
{
fill: #ff533d;
}
.needle, .needle-center
{
fill: #000000;
}
.text {
color: "#112864";
font-size: 16px;
}
svg {
font: 10px sans-serif;
}
</style><script src="https://cdnjs.cloudflare.com/ajax/libs/d3/3.0.0/d3.min.js"></script>
<div class="chart-gauge"></div>