¿Cómo calcular porcentajes en un diagrama de barras apilado en forma de barra?
Problema
Los porcentajes actuales en la barra se calculan con la cantidad total de datos. Quiero que cada pila tenga un 100%. (Resuelto)
Además, los porcentajes deben redondearse al número entero más cercano. (Resuelto)
Editar: Eliminar todos los porcentajes inferiores o iguales a 1. (Resuelto)
Edit2: Asegúrese de que las etiquetas no se superpongan.
He estado buscando en Google por un tiempo ahora. Parece que no hay una manera adecuada de evitar la superposición de etiquetas.
Posibles soluciones que descubrí:
Voltear la tramaAñadir ángulo () para rotar las etiquetas"Manualmente" calcule cada posiciónUtilice check_overlap = TRUEEstado actual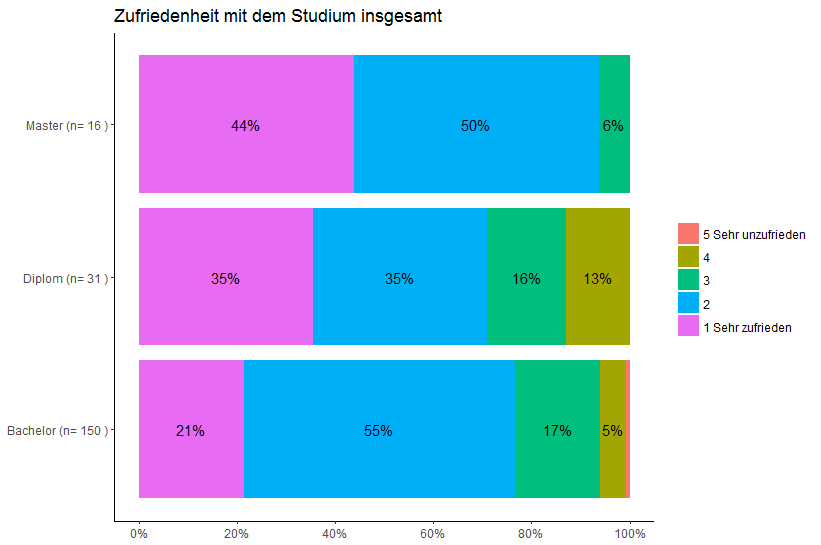
# Load libraries & packages =================================
library("ggplot2")
library("scales")
library("dplyr")
library("foreign")
library("tidyverse")
library("forcats")


# Data setup =================================
spss_file_path <- "D:\\Programming\\Testing\\2017-03-15_data_import&ggplot2\\Beispieldatensatz(fiktiv).sav"
exampledata <- read.spss(spss_file_path, use.value.labels = TRUE,
                         to.data.frame = TRUE, reencode = TRUE)


exampledata$V43   <- factor(exampledata$V43,
                            levels = c(1,2,3,4,5),
                            labels = c("1 Sehr zufrieden","2","3","4", "5 Sehr unzufrieden"))

exampledata$V43   <- factor(exampledata$V43, levels = rev(unique(levels(exampledata$V43))))
exampledata$A_REF <- factor(exampledata$A_REF, levels = rev(unique(levels(exampledata$A_REF))))
exampledata$V101  <- factor(exampledata$V101, levels = rev(unique(levels(exampledata$V101))))

labels <- exampledata %>%
  filter(!is.na(V101), !is.na(V43)) %>%
  count(A_REF) %>%
  mutate(labels = paste(A_REF,"(n=", n, ")")) %>%
  select(A_REF, labels)

plot_data <-  exampledata %>%
  filter(!is.na(V101), !is.na(V43)) %>%
  left_join(labels, by = "A_REF")

plot_data <- plot_data %>%
  group_by(labels) %>%
  summarize(`5 Sehr unzufrieden` = sum(ifelse(V43 == "5 Sehr unzufrieden", 1, 0)) / n(),
            `4` = sum(ifelse(V43 == "4", 1, 0)) / n(),
            `3` = sum(ifelse(V43 == "3", 1, 0)) / n(),
            `2` = sum(ifelse(V43 == "2", 1, 0)) / n(),
            `1 Sehr zufrieden` = sum(ifelse(V43 == "1 Sehr zufrieden", 1, 0)) / n()) %>%
  gather(key = Rating, value = prop, -labels)

plot_data$labels <- factor(plot_data$labels)
plot_data$Rating <- factor(plot_data$Rating) %>% fct_rev()

# Plot =================================
ggplot(plot_data, aes(x = labels, y = prop, fill = Rating)) +
  geom_col() +
  scale_y_continuous(labels = scales::percent, breaks = c(0, 0.2, 0.4, 0.6, 0.8, 1)) +
  labs(y=NULL, x=NULL, fill=NULL) +
  ggtitle(paste(attr(exampledata, "variable.labels")[77])) +
  theme_classic() +
  geom_text(aes(label = if_else(prop > 0.02, scales::percent(round(prop, 2)), NULL)), position = position_fill(vjust=0.5)) +
  coord_flip()
structure(list(exampledata.V101 = structure(c(2L, NA, 2L, 2L,
2L, 2L, 1L, 1L, 1L, 2L, 1L, 2L, 2L, NA, 2L, 2L, 2L, 1L, 2L, NA,
NA, NA, 1L, 1L, 2L, NA, 2L, 2L, 2L, NA, 2L, 2L, NA, NA, 1L, NA,
2L, 2L, 2L, 1L, 2L, 2L, 2L, 2L, NA, NA, 2L, 2L, 2L, 2L, 2L, 2L,
2L, 2L, 2L, 1L, 1L, 2L, 2L, 2L, 2L, 1L, 2L, NA, 1L, NA, 1L, NA,
1L, 2L, NA, NA, 2L, NA, 1L, 2L, 2L, NA, 2L, NA, 2L, 2L, 1L, 2L,
1L, 2L, 1L, 1L, 2L, 1L, NA, 2L, 2L, 2L, 2L, NA, 2L, 1L, 2L, 2L
), .Label = c("Weiblich", "Männlich"), class = "factor"), exampledata.A_REF = structure(c(18L,
18L, 18L, 18L, 18L, 17L, 18L, 18L, 18L, 18L, 18L, 18L, 16L, 18L,
18L, 18L, 18L, 18L, 18L, 18L, 18L, 18L, 16L, 18L, 18L, 16L, 18L,
16L, 18L, 18L, 17L, 18L, 18L, 18L, 18L, 18L, 18L, 18L, 18L, 18L,
16L, 18L, 18L, 17L, 18L, 18L, 18L, 18L, 18L, 18L, 17L, 16L, 18L,
18L, 18L, 18L, 18L, 18L, 18L, 18L, 18L, 18L, 18L, 17L, 18L, 18L,
16L, 18L, 16L, 18L, 18L, 16L, 16L, 18L, 18L, 18L, 18L, 18L, 18L,
18L, 17L, 18L, 18L, 18L, 18L, 18L, 18L, 18L, 18L, 18L, 16L, 18L,
16L, 16L, 18L, 18L, 18L, 17L, 16L, 18L), .Label = c("Zertifikat eines Aufbau- oder Ergänzungsstudiums",
"LA Berufliche Schulen", "LA Sonderschule", "LA Gymnasium", "LA Haupt- und Realschule",
"LA Grundschule", "Künstlerischer/musischer Abschluss", "Kirchlicher Abschluss",
"Staatsexamen (ohne Lehramt)", "Diplom Fachhochschule, Diplom I an Gesamthochschulen",
"Diplom Universität, Diplom II an Gesamthochschulen", "Sonstiges",
"Promotion", "Staatsexamen", "Magister", "Diplom", "Master",
"Bachelor"), class = "factor"), exampledata.V43 = structure(c(3L,
5L, 4L, 4L, 4L, 4L, 4L, 5L, 5L, 4L, 3L, 3L, 2L, NA, 4L, 5L, 5L,
4L, 4L, 4L, 4L, NA, 2L, 4L, 3L, 5L, 4L, 4L, 4L, NA, 4L, 4L, NA,
NA, 3L, 5L, 2L, 4L, 5L, 4L, 4L, 5L, 5L, 4L, NA, NA, 4L, NA, 3L,
4L, 5L, 5L, 2L, 4L, 4L, 3L, 4L, 4L, 4L, 3L, 5L, 4L, 5L, NA, 4L,
NA, 4L, NA, 4L, 5L, 4L, NA, 5L, NA, 4L, 4L, 4L, NA, 4L, NA, 5L,
4L, 4L, 4L, 4L, 4L, 3L, 3L, 4L, 2L, 4L, 4L, 4L, 3L, 4L, NA, 4L,
5L, 5L, 4L), .Label = c("5 Sehr unzufrieden", "4", "3", "2",
"1 Sehr zufrieden"), class = "factor")), .Names = c("exampledata.V101",
"exampledata.A_REF", "exampledata.V43"), row.names = c(NA, 100L
), class = "data.frame")