Identificar la posición de un clic en un ráster en el folleto, en R
Estoy tramando un gran NetCDF lat-lonraster sobre una Rleaflet mapa usandoshinydashboard. Cuando hago clic en el mapa, aparece una ventana emergente que muestra la fila, la columna, la posición del lat-lon y el valor del punto ráster en el que se hizo clic. (Ver código reproducible a continuación)
El problema es que estoy experimentando un cambio en el ráster si el ráster es lo suficientemente grande. Por ejemplo, aquí hice clic en un punto que debería tener un valor, pero el resultado es que el punto identificado es el de arriba.
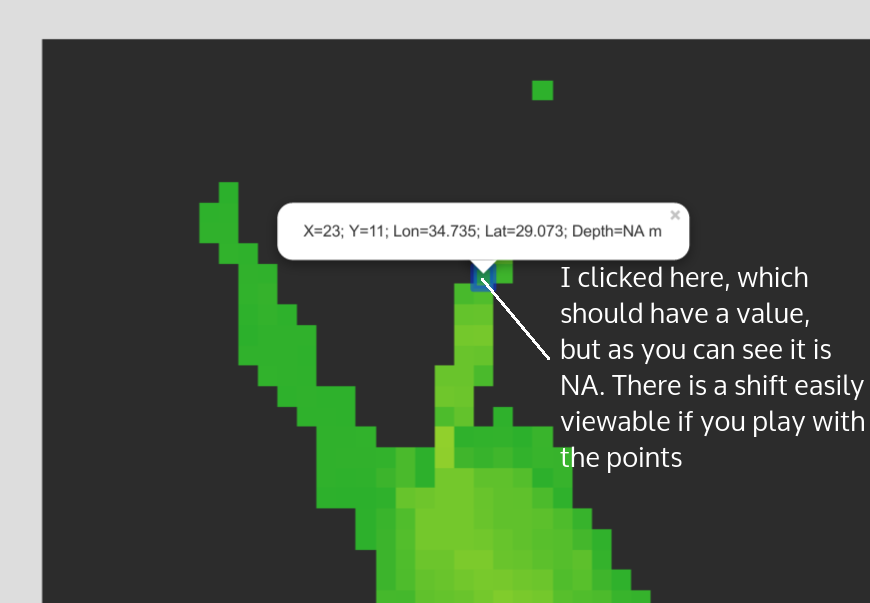
Creo que esto tiene que ver con el hecho de que la trama utilizada porleaflet se proyecta, mientras que los datos sin procesar que uso para identificar los puntos son Lat-Lon, ya que el punto cliqueado se devuelve como Lat-Lon porleaflet. No puedo usar el archivo proyectado (depth) ya que sus unidades están en metros, ¡no en grados! Incluso si intentara reproyectar esos metros a grados, tengo un turno.
Aquí hay un ejemplo básico ejecutable del código:
#Libraries
library(leaflet)
library(raster)
library(shinydashboard)
library(shiny)

#Input data
download.file("https://www.dropbox.com/s/y9ekjod2pt09rvv/test.nc?dl=0", destfile="test.nc")
inputFile    = "test.nc"
inputVarName = "Depth"
lldepth <- raster(inputFile, varname=inputVarName)
lldepth[Which(lldepth<=0, cells=T)] <- NA #Set all cells <=0 to NA
ext <- extent(lldepth)
resol <- res(lldepth)
projection(lldepth) <- "+proj=longlat +datum=WGS84 +ellps=WGS84 +towgs84=0,0,0"

#Project for leaflet
depth <- projectRasterForLeaflet(lldepth)

#Prepare UI
sbwidth=200
sidebar <- dashboardSidebar(width=sbwidth)
body <- dashboardBody(
          box( #https://stackoverflow.com/questions/31278938/how-can-i-make-my-shiny-leafletoutput-have-height-100-while-inside-a-navbarpa
            div(class="outer",width = NULL, solidHeader = TRUE, tags$style(type = "text/css", paste0(".outer {position: fixed; top: 50px; left: ", sbwidth, "px; right: 0; bottom: 0px; overflow: hidden; padding: 0}")),
            leafletOutput("map", width = "100%", height = "100%")
            )
          )
        )
ui <- dashboardPage(
  dashboardHeader(title = "A title"),
  sidebar,
  body
)
#
#Server instance
server <- function(input, output, session) {
  output$map <- renderLeaflet({#Set extent
    leaflet()  %>%
      fitBounds(ext[1], ext[3], ext[2], ext[4])
  })

  observe({#Observer to show Popups on click
    click <- input$map_click
    if (!is.null(click)) {
      showpos(x=click$lng, y=click$lat)
    }
  })

  showpos <- function(x=NULL, y=NULL) {#Show popup on clicks
    #Translate Lat-Lon to cell number using the unprojected raster
    #This is because the projected raster is not in degrees, we cannot use it!
    cell <- cellFromXY(lldepth, c(x, y))
    if (!is.na(cell)) {#If the click is inside the raster...
      xy <- xyFromCell(lldepth, cell) #Get the center of the cell
      x <- xy[1]
      y <- xy[2]
      #Get row and column, to print later
      rc <- rowColFromCell(lldepth, cell)
      #Get value of the given cell
      val = depth[cell]
      content <- paste0("X=",rc[2],
                        "; Y=",rc[1],
                        "; Lon=", round(x, 5),
                        "; Lat=", round(y, 5),
                        "; Depth=", round(val, 1), " m")
      proxy <- leafletProxy("map")
      #add Popup
      proxy %>% clearPopups() %>% addPopups(x, y, popup = content)
      #add rectangles for testing
      proxy %>% clearShapes() %>% addRectangles(x-resol[1]/2, y-resol[2]/2, x+resol[1]/2, y+resol[2]/2)
    }
  }

  #Plot the raster
  leafletProxy("map") %>%
    addRasterImage(depth, opacity=0.8, project=FALSE, group="Example", layerId="Example", colors=colorNumeric(terrain.colors(10), values(depth), na.color = "black"))
}


print(shinyApp(ui, server))
¿Cómo puedo identificar correctamente los puntos, si el ráster es grande?
EDITAR: También quería proporcionar algunos enlaces adicionales a (posiblemente) documentación o preguntas relacionadas:
La imagen de trama parece cambiarse usando el folleto para RR para la redirección de folletos al hacer clic en la imagen rásterhttps://gis.stackexchange.com/questions/183918/is-it-possible-to-use-a-rasterclick-event-within-an-interactive-leaflet-mapevento de clic del mouse del marcador en el folleto R para brillo