конечно, версия dev_tools может иметь такую возможность, но вы также можете вернуться к предыдущим версиям, если вам это просто нужно (google - ваш друг по возвращению версий)
я есть вопрос относительно поля заполнения вgeom_bar пакета ggplot2.
Я хотел бы заполнить мой geom_bar с переменной (в следующем примере переменная называетсяvar_fill) но заказатьgeom_plot с другой переменной (называетсяclarity в примере).
Как я могу это сделать?
Большое спасибо!
Пример:
rm(list=ls())

set.seed(1)

library(dplyr)
data_ex <- diamonds %>%
  group_by(cut, clarity) %>%
  summarise(count = n()) %>%
  ungroup() %>%
  mutate(var_fill= LETTERS[sample.int(3, 40, replace = TRUE)])

head(data_ex)

# A tibble: 6 x 4
   cut  clarity count var_fill
  <ord>   <ord> <int>    <chr>
1  Fair      I1   210        A
2  Fair     SI2   466        B
3  Fair     SI1   408        B
4  Fair     VS2   261        C
5  Fair     VS1   170        A
6  Fair    VVS2    69        C
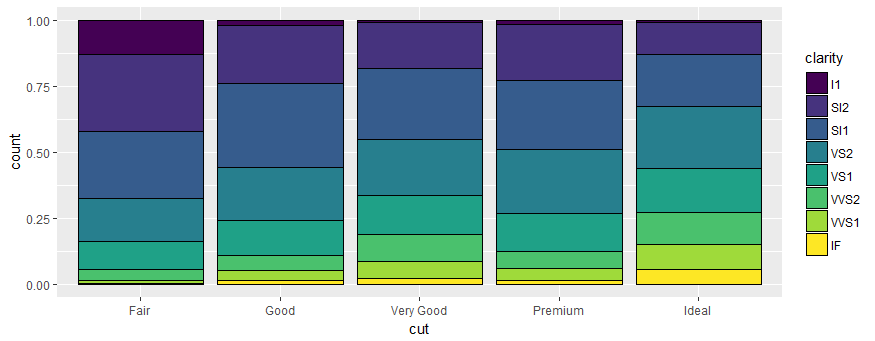
Я хотел бы этот порядок коробок [ясность]:
library(ggplot2)
ggplot(data_ex) +
  geom_bar(aes(x = cut, y = count, fill=clarity),stat = "identity", position = "fill", color="black")
с этим заполнением (цветом) полей [var_fill]:
ggplot(data_ex) +
  geom_bar(aes(x = cut, y = count, fill=var_fill),stat = "identity", position = "fill", color="black")

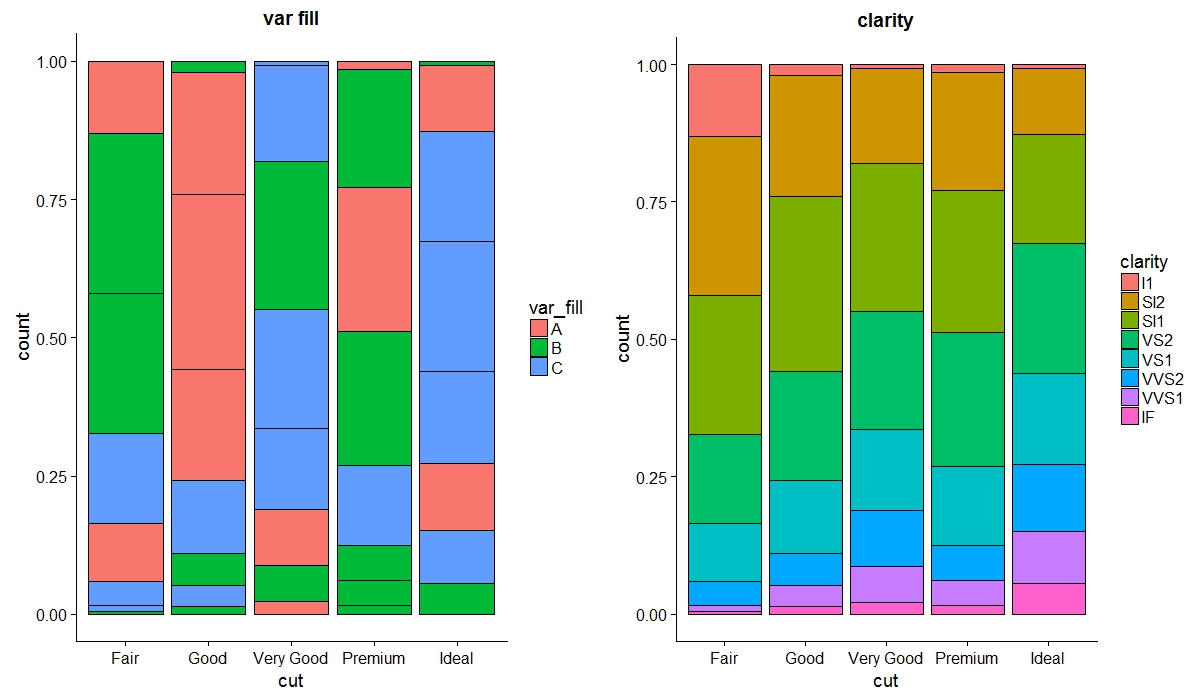
EDIT1: ответ найден по ошибке
p1 <- ggplot(data_ex) + geom_bar(aes(x = cut, y = count, group = clarity, fill = var_fill), stat = "identity", position = "fill", color="black")+ ggtitle("var fill")

p2 <- ggplot(data_ex) +  geom_bar(aes(x = cut, y = count, fill = clarity), stat = "identity", position = "fill", color = "black")+ ggtitle("clarity")

library(cowplot)
cowplot::plot_grid(p1, p2)
РЕДАКТИРОВАТЬ 2: Теперь я попытался сделать это с расширением ggmosaic с помощью missuse
rm(list=ls())
set.seed(1)
library(ggplot2)
library(dplyr)
library(ggmosaic)
data_ex <- diamonds %>%
group_by(cut, clarity) %>%
summarise(count = n()) %>%
ungroup() %>%
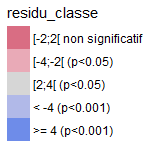
mutate(residu= runif(nrow(.), min=-4.5, max=5)) %>%
mutate(residu_classe = case_when(residu < -4~"< -4 (p<0.001)",(residu >= -4 & residu < -2)~"[-4;-2[ (p<0.05)",(residu >= -2 & residu < 2)~"[-2;2[ non significatif",(residu >= 2 & residu < 4)~"[2;4[ (p<0.05)",residu >= 4~">= 4 (p<0.001)")) %>%
mutate(residu_color = case_when(residu < -4~"#D04864",(residu >= -4 & residu < -2)~"#E495A5",(residu >= -2 & residu < 2)~"#CCCCCC",(residu >= 2 & residu < 4)~"#9DA8E2",residu >= 4~"#4A6FE3"))
ggplot(data_ex) +
geom_mosaic(aes(weight= count, x=product(clarity, cut)), fill = data_ex$residu_color, na.rm=T)+
scale_y_productlist() +
theme_classic() +
theme(axis.ticks=element_blank(), axis.line=element_blank())+
labs(x = "cut",y="clarity")

Но я хотел бы добавить эту легенду (ниже) справа от графика, но я не знаю, как я мог бы это сделать, потому что поле заполнения находится за пределами aes, поэтому scale_fill_manual не работает ...