Matplotlib streamplot стрелки, указывающие не в ту сторону
Я создаю контур возвышения подземных вод и стримплот в matplotlib
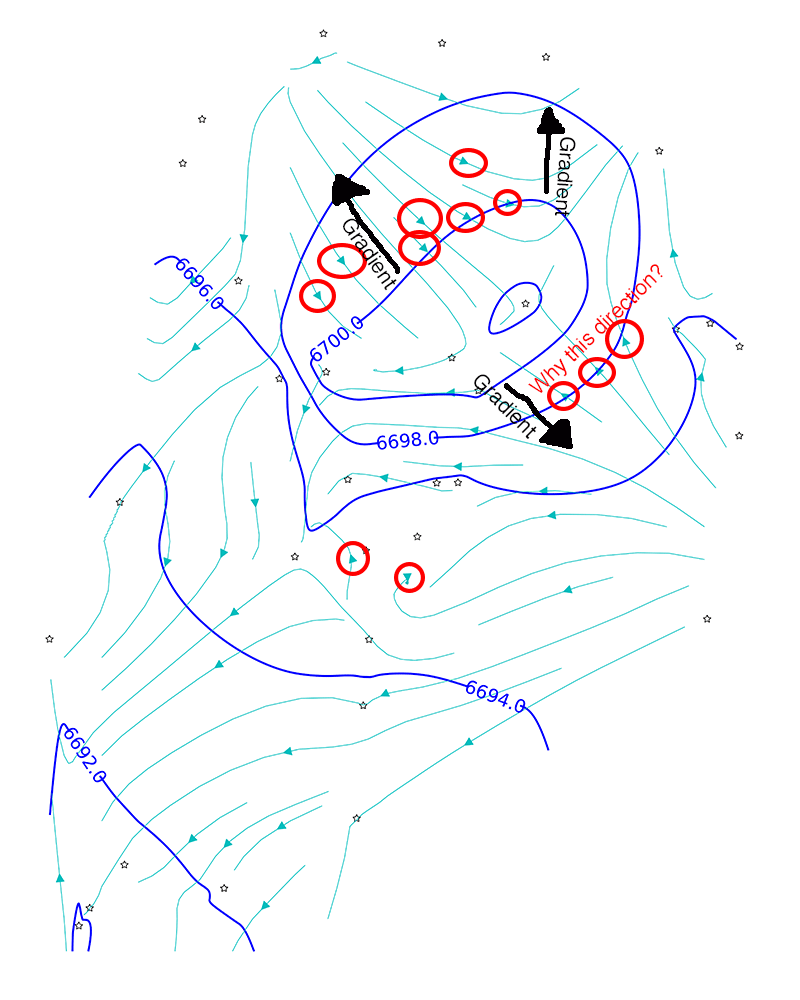
Контур показывает, что высота снижается во многих областях, но поток грунтовых вод (стримплот) направлен вверх. Я обвел стрелки, которые, кажется, направлены не в том направлении.
Стрелки внизу карты, кажется, указывают правильное направление. Кто-нибудь знает, почему это может быть?
И вот большая часть кода, который генерирует этот график:
#create empty arrays to fill up!
x_values = []
y_values = []
z_values = []

#iterate over wells and fill the arrays with well data
for well in well_arr:
    x_values.append(well['xpos'])
    y_values.append(well['ypos'])
    z_values.append(well['value'])

#initialize numpy array as required for interpolation functions
x = np.array(x_values, dtype=np.float)
y = np.array(y_values, dtype=np.float)
z = np.array(z_values, dtype=np.float)

#create a list of x, y coordinate tuples
points = zip(x, y)

#create a grid on which to interpolate data
xi, yi = np.linspace(0, image['width'], image['width']),
         np.linspace(0, image['height'], image['height'])
xi, yi = np.meshgrid(xi, yi)

#interpolate the data with the matlab griddata function
zi = griddata(x, y, z, xi, yi, interp='nn')

#create a matplotlib figure and adjust the width and heights
fig = plt.figure(figsize=(image['width']/72, image['height']/72))

#create a single subplot, just takes over the whole figure if only one is specified
ax = fig.add_subplot(111, frameon=False, xticks=[], yticks=[])

#create the contours
kwargs = {}
if groundwater_contours:
    kwargs['colors'] = 'b'

CS = plt.contour(xi, yi, zi, linewidths=linewidth, **kwargs)

#add a streamplot
dx, dy = np.gradient(zi)
plt.streamplot(xi, yi, dx, dy, color='c', density=1, arrowsize=3)