R: legenda compartilhada de uma subtrama para o painel grid.arrange 2x2 com Lattice [duplicado]
Esta pergunta já tem uma resposta aqui:
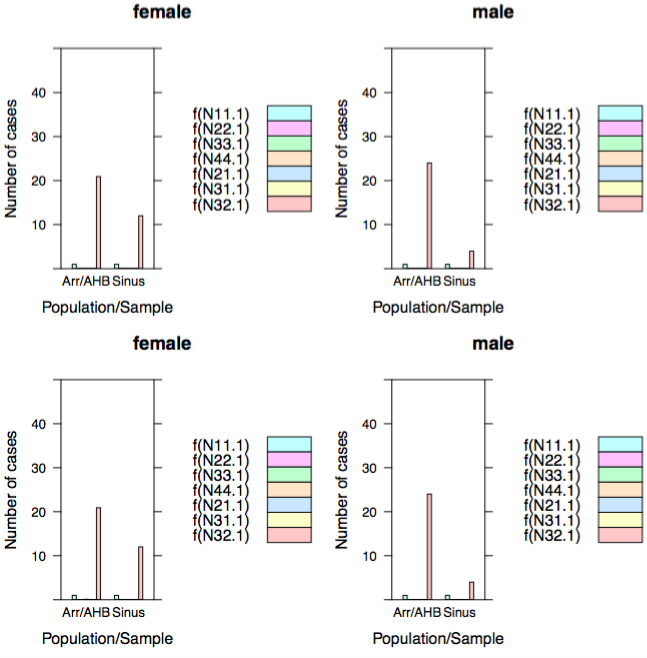
Legenda global usando grid.arrange (gridExtra) e gráficos baseados em treliça 3 respostasEu estou trabalhando nessa questãoaqui para obter uma legenda de uma subparcela de plotagens 2x2 para toda a janela. O objetivo é obter uma única legenda e remover as outras legendas, apenas uma legenda é suficiente e deve ser posicionada à direita de todo o painel.
Talvez relevante
Legenda global usando grid.arrange (gridExtra) e gráficos baseados em treliçaCódigo
require(lattice)
require(gridExtra)

f<-function(x) as.double(as.character(x))   #factors converted to vectors https://stackoverflow.com/a/40680020/54964

data.female <- structure(list(N11.1 = structure(c(3L, 3L), .Label = c("", "0.0",
"1.0", "N11"), class = "factor"), N22.1 = structure(c(2L, 2L), .Label = c("",
"0.0", "2.0", "N22"), class = "factor"), N33.1 = structure(c(2L,
2L), .Label = c("", "0.0", "N33"), class = "factor"), N44.1 = structure(2:3, .Label = c("",
"0.0", "0.1", "0.2", "N44"), class = "factor"), N21.1 = structure(c(2L,
2L), .Label = c("", "0.0", "N21"), class = "factor"), N31.1 = structure(c(2L,
2L), .Label = c("", "0.0", "N31"), class = "factor"), N32.1 = structure(c(5L,
7L), .Label = c("", "0.0", "10.8", "11.0", "12.0", "17.0", "20.9",
"22.8", "24.0", "3.0", "4.0", "44.0", "N32"), class = "factor")), .Names = c("N11.1",
"N22.1", "N33.1", "N44.1", "N21.1", "N31.1", "N32.1"), row.names = c("Sinus",
"Arr/AHB"), class = "data.frame")

data.male <- structure(list(N11.1 = structure(c(3L, 3L), .Label = c("", "0.0",
"1.0", "N11"), class = "factor"), N22.1 = structure(c(2L, 2L), .Label = c("",
"0.0", "2.0", "N22"), class = "factor"), N33.1 = structure(c(2L,
2L), .Label = c("", "0.0", "N33"), class = "factor"), N44.1 = structure(c(2L,
2L), .Label = c("", "0.0", "0.1", "0.2", "N44"), class = "factor"),
    N21.1 = structure(c(2L, 2L), .Label = c("", "0.0", "N21"), class = "factor"),
    N31.1 = structure(c(2L, 2L), .Label = c("", "0.0", "N31"), class = "factor"),
    N32.1 = structure(c(11L, 9L), .Label = c("", "0.0", "10.8",
    "11.0", "12.0", "17.0", "20.9", "22.8", "24.0", "3.0", "4.0",
    "44.0", "N32"), class = "factor")), .Names = c("N11.1", "N22.1",
"N33.1", "N44.1", "N21.1", "N31.1", "N32.1"), row.names = c("Sinus",
"Arr/AHB"), class = "data.frame")

ID<-c("Sinus","Arr/AHB")

tl <- "female"
p1 <- barchart(f(N11.1)+f(N22.1)+f(N33.1)+f(N44.1)+f(N21.1)+f(N31.1)+f(N32.1) ~ ID,
         data=data.female,
         auto.key=list(space='right'),
         ylim=c(0,50),
     beside=TRUE,
     ylab = "Number of cases",
     xlab = "Population/Sample",
     main = tl
         )
tl <- "male"
p2 <- barchart(f(N11.1)+f(N22.1)+f(N33.1)+f(N44.1)+f(N21.1)+f(N31.1)+f(N32.1) ~ ID,
         data=data.male,
         auto.key=list(space='right'),
         ylim=c(0,50),
     beside=TRUE,
     ylab = "Number of cases",
     xlab = "Population/Sample",
     main = tl
         )

# Just repeat two barcharts more to get 2x2 example
tl <- "female"
p3 <- barchart(f(N11.1)+f(N22.1)+f(N33.1)+f(N44.1)+f(N21.1)+f(N31.1)+f(N32.1) ~ ID,
         data=data.female,
         auto.key=list(space='right'),
         ylim=c(0,50),
     beside=TRUE,
     ylab = "Number of cases",
     xlab = "Population/Sample",
     main = tl
         )
tl <- "male"
p4 <- barchart(f(N11.1)+f(N22.1)+f(N33.1)+f(N44.1)+f(N21.1)+f(N31.1)+f(N32.1) ~ ID,
         data=data.male,
         auto.key=list(space='right'),
         ylim=c(0,50),
     beside=TRUE,
     ylab = "Number of cases",
     xlab = "Population/Sample",
     main = tl)


grid.arrange(p1,p2,p3,p4, ncol=2, nrow=2,left=("LEFT TITLE"),right=("RIGHT"),bottom=("BOTTOM"), top=("TOP"))
que compila a produção dos gráficos de grade acima, mas o seguinte não funciona devido à legenda
grid.arrange(p1,p2,p3,p4, ncol=2, nrow=2,
        legend=list(space='right',
        text=c("N11.1","N22.1","N33.1","N44.1","N21.1","N31.1","N32.1"),
                    columns=1))
onde a maneira mais fácil seria herdar a legenda de algumas das subparcelas e usar algo comoauto.key mas não consegui que esse commond funcionasse, tentando criar o objeto grop com o comando legend.
O que há de errado no comando legend e existe alguma maneira conveniente de herdar a legenda das subparcelas para todo o painel, para que a auto.key possa ser usada na parte externa do painel?
Perguntas auxiliares
Como as cores são herdadas do comando automático de criação de glob auto.key para a legenda?
Em vez de escrever manualmente os rótulos das legendas (N11.1, N22.1, ...), como você pode obtê-lo convenientemente de uma subparcela?