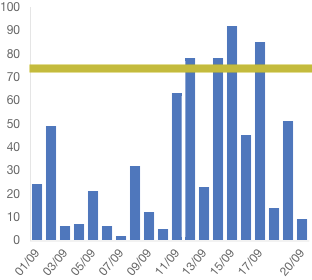
Gráfico Js V2 dibujar barra horizontal (promedio) sobre barra vertical
Quiero dibujar una sola barra sobre barras verticales (barra verde). Estoy usando Chart JS V2 con Angular 4.
Encontré un código para dibujar líneas, pero no funciona en Angular 4.
Solía también intenté usarannotation Pero no está funcionando. Comando para agregar anotaciones:npm install chartjs-plugin-annotation --save
A continuación se muestra mi código, funciona bien para dibujar barras verticales solamente. ¿Alguien puede ayudarme a dibujar una línea horizontal sobre él?
Responder:
Instalar en pcnpm install chartjs-plugin-annotation --save
Entoncesimport 'chartjs-plugin-annotation';
this.ctx = document.getElementById("myChart");
    this.myChart = new Chart(this.ctx, {
        type: 'bar',
        data: {
            labels: this.barData.getLabels(),
            datasets: [{
                label: this.barData.actualLegendLabel,
                data: this.barData.getLineData(),
                backgroundColor: this.backgroundColorBarOne,
                borderColor: [
                    'rgba(81,117, 194,1)',
                ]}]
        },
        options: {
            scales: {
                responsive: true,
                scaleBeginAtZero: false,
                barBeginAtOrigin: true,
                yAxes: [{
                    ticks: {
                        beginAtZero: true
                    },
                    gridLines: {
                        display: false
                    }
                }],
                xAxes: [{
                    ticks: {
                        beginAtZero: true
                    },
                    gridLines: {
                        display: false
                    }
                }]
            },
            legend: {
                cursor: "line",
                position: 'top',
                labels: {
                    fontSize: 10,
                }
            },
            layout: {
                padding: {
                    left: 3,
                    right: 3,
                    top: 5,
                    bottom: 5
                }
            }, annotation: {
                annotations: [{
                    drawTime: 'afterDraw', // overrides annotation.drawTime if set
                    id: 'a-line-1', // optional
                    type: 'line',
                    mode: 'horizontal',
                    scaleID: 'y-axis-0',
                    value: '25',
                    borderColor: 'red',
                    borderWidth: 2,
                    // Fires when the user clicks this annotation on the chart
                    // (be sure to enable the event in the events array below).
                    onClick: function(e) {
                        // `this` is bound to the annotation element
                    }
                }]
            }
        }
    });