Haga varias líneas con animación desde la última posición hasta las nuevas posiciones.
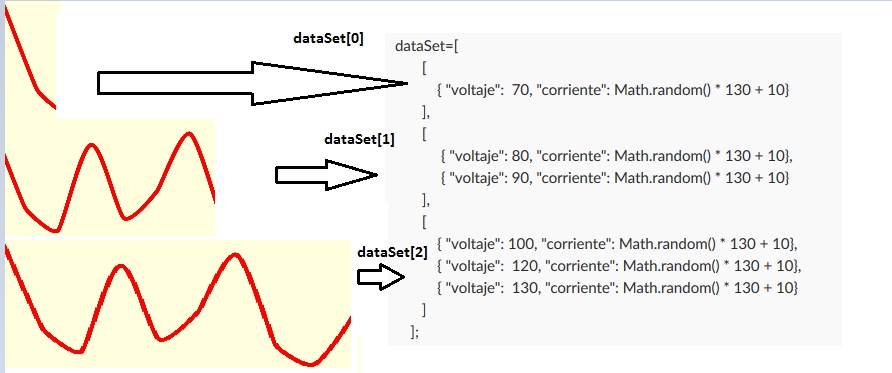
En mi problema real, estoy consumiendo un servicio web que devuelve una matriz con puntos en x e y. Esta es la estructura de la matriz que puedo recibir.
  var dataSet=[
    [
      { "voltaje":  10, "corriente": Math.random() * 130 + 10},
      { "voltaje":  40, "corriente": Math.random() * 130 + 10},
      { "voltaje": 70, "corriente": Math.random() * 130 + 10}
    ],
     [
      { "voltaje": 100, "corriente": Math.random() * 130 + 10},
      { "voltaje":  130, "corriente": Math.random() * 130 + 10},
      { "voltaje":  160, "corriente": Math.random() * 130 + 10},
      { "voltaje":  190, "corriente": Math.random() * 130 + 10}
    ]
  ];
Actualmente tengo este código que funciona para una estructura como esta:
var dataset=  [{
  x: d * 30 + 10,
  y: Math.random() * 130 + 10
},
{
  x: d * 30 + 10,
  y: Math.random() * 130 + 10
}
]
y en este código obtengo lo que quiero. Algunas líneas están pintadas con una animación. y se simula como si el servicio web devolviera algunos puntos, luego se agregan estos nuevos puntos y la animación de la línea continúa desde el último punto hasta el nuevo punto.
Quiero tener los puntos y la animación de cada matriz por separado, por ejemplo:
Me gustaría adaptar mi nueva estructura a este código y separarlo en varias líneas, pero no he podido hacerlo. ¿Cómo puedo hacerlo?
  var svg = d3.select('svg');

  var backLayer = svg.append("g");
  var frontLayer = svg.append("g");

  var dataSet = d3.range(10).map(function(d) {
    return {
      x: d * 30 + 10,
      y: Math.random() * 130 + 10
    }
  });

  var lineGenerator = d3.svg.line()
    .x(function(d) {
      return d.x
    })
    .y(function(d) {
      return d.y
    })
    .interpolate("monotone")

  function displayLine(data) {
    var line = backLayer.selectAll(null)
      .data(data)
      .enter()
      .append("path")
      .attr({
        d: lineGenerator(data),
        fill: 'none',
        stroke: "red",
        "stroke-width": "3px"
      });

    var totalLength = line.node().getTotalLength();

    line.attr("stroke-dasharray", totalLength + " " + totalLength)
      .attr("stroke-dashoffset", totalLength)
      .transition()
      .duration(2000)
      .ease("linear")
      .attr("stroke-dashoffset", 0);
  }

  displayLine(dataSet)

  setTimeout(function() {
   setInterval(function() {
   var newData = { x: (dataSet.length) * 30 + 10, y: Math.random() * 130 + 10 };
   displayLine([dataSet[dataSet.length - 1], newData]);
   dataSet.push(newData);
  }, 2000);
  }, 2000);