segmentación de línea en D3.js
He creado una línea que conecta varios puntos de datos en D3, como parte de un proyecto de visualización de música:
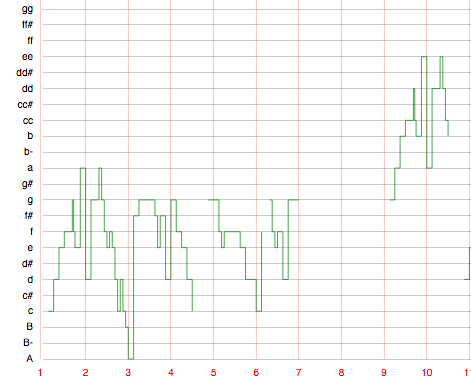
Sin embargo, necesito colorear varios segmentos de línea de manera diferente. Hice esto creando varias líneas en lugar de usar el generador line () (es decir, una línea por segmento), sin embargo, perdí mimás buscado interpolación de esta manera:
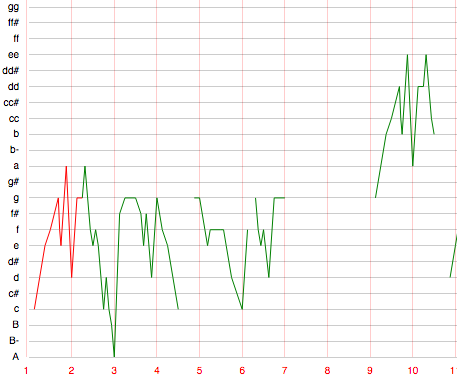
Aviso: El color del trazo será diferente no solo al principio, sino también en otros segmentos de la línea.
Por lo tanto, me gustaría preguntar si hay una manera de combinar ambas características (diferentes trazos de color e interpolación paso a paso). Aquí está la parte principal de mi código (ejemplo d3.svg.line ()), como una pista:
<script>
var margin = {top: 20, right: 20, bottom: 30, left: 50},
    width = 1200 - margin.left - margin.right,
    height = 500 - margin.top - margin.bottom;

var x = d3.scale.linear()
    .range([0, width]);

var y = d3.scale.linear()
    .range([height, 100]);

var tickValuesArray = [0];
for (var i = 1; i < 27; i++) {
  var newTick = i*16+1;
  tickValuesArray.push(newTick);
}

var xAxis = d3.svg.axis()
    .scale(x)
    .orient("bottom")
    .tickValues(tickValuesArray)
    .tickFormat(function(d,i) {return i+1 })
    .innerTickSize(-height)
    .tickPadding(10);

var yAxis = d3.svg.axis()
    .scale(y)
    .orient("left")
    .ticks(22)
    .tickFormat(function(d) {
      if (d == 0) {return "A"}
      else if (d == 1) {return "B-"}
      else if (d == 2) {return "B"}
      else if (d == 3) {return "c"}
      else if (d == 4) {return "c#"}
      else if (d == 5) {return "d"}
      else if (d == 6) {return "d#"}
      else if (d == 7) {return "e"}
      else if (d == 8) {return "f"}
      else if (d == 9) {return "f#"}
      else if (d == 10) {return "g"}
      else if (d == 11) {return "g#"}
      else if (d == 12) {return "a"}
      else if (d == 13) {return "b-"}
      else if (d == 14) {return "b"}
      else if (d == 15) {return "cc"}
      else if (d == 16) {return "cc#"}
      else if (d == 17) {return "dd"}
      else if (d == 18) {return "dd#"}
      else if (d == 19) {return "ee"}
      else if (d == 20) {return "ff"}
      else if (d == 21) {return "ff#"}
      else {return "gg"};
    })
    .innerTickSize(-width)
    .tickPadding(10);

var line = d3.svg.line()
    .interpolate("step-after")
    .defined(function(d) { return !isNaN(d.pitch); })
    .x(function(d) {
      return x(d.times);
    })
    .y(function(d) {
      return y(d.pitch);
    });

var svg = d3.select("body").append("svg")
    .attr("width", width + margin.left + margin.right)
    .attr("height", height + margin.top + margin.bottom)
  .append("g")
    .attr("transform", "translate(" + margin.left + "," + margin.top + ")");


d3.tsv("linearAcomplete.tsv", type, function(error, data) {
  if (error) throw error;

  x.domain(d3.extent(data, function(d) { return d.times; }));
  y.domain(d3.extent(data, function(d) { return d.pitch; }));

  svg.append("g")
      .attr("class", "x axis")
      .attr("transform", "translate(0," + height + ")")
      .call(xAxis);

  svg.append("g")
      .attr("class", "y axis")
      .call(yAxis)
    .append("text")
      .attr("transform", "rotate(-90)")
      .attr("y", 6)
      .attr("dy", ".71em")
      .style("text-anchor", "end")
      .text("Pitch");

  svg.append("path")
      .datum(data)
      .attr("class", "line")
      .attr("d", line)
      .attr("stroke", "green"); // can I be more "flexible" here?

});

function type(d) {
  d.times = +d.times;
  d.pitch = +d.pitch;
  d.duration = +d.duration;
  return d;
}
</script>
¡Gracias por cualquier consejo que puedas dar! Saludos - Ilias