JFreeChart с усеченными точками данных
Я создал JFreeChart с кодом ниже, но метки оси Y усекаются. Как мне отобразить график, даже если точки данных перекрываются по оси Y? По сути, я хочу, чтобы точки оси Y были сгенерированы из моего файла, чтобы на графике был задан правильный диапазон.
private static JFreeChart buildChart(TimeSeriesCollection dataset,
    String title, boolean endPoints) throws IOException {

// Create the chart

    JFreeChart chart0 = ChartFactory.createTimeSeriesChart(
        title, "Hour", "Count", dataset, true, true, false);

// Setup the appearance of the chart
    chart0.setBackgroundPaint(Color.white);
    XYPlot plot = (XYPlot) chart0.getXYPlot();
    plot.setBackgroundPaint(Color.lightGray);
    plot.setDomainGridlinePaint(Color.white);
    plot.setRangeGridlinePaint(Color.white);
    plot.setAxisOffset(new RectangleInsets(10.0, 10.0, 10.0, 10.0));
    plot.setDomainCrosshairVisible(true);
    plot.setRangeCrosshairVisible(true);

// Display data points or just the lines?

    if (endPoints) {
        XYItemRenderer renderer = plot.getRenderer();
        if (renderer instanceof StandardXYItemRenderer) {
            StandardXYItemRenderer rr = (StandardXYItemRenderer) renderer;

            rr.setBaseShapesVisible(true);
            rr.setBaseShapesFilled(true);
            rr.setDrawSeriesLineAsPath(true);
            rr.setSeriesPaint(0, Color.blue.brighter());
            rr.setSeriesVisible(0, true); // default
            rr.setSeriesVisibleInLegend(0, true);  // default

            NumberAxis domainAxis = new NumberAxis();
            domainAxis.setUpperMargin(0.15);
            domainAxis.setStandardTickUnits(NumberAxis.createIntegerTickUnits());
            domainAxis = (NumberAxis) plot.getDomainAxis();
            domainAxis = (NumberAxis) plot.getRangeAxis();
            domainAxis.setAutoRangeIncludesZero(false);
        }
    }

 // Tell the chart how we would like dates to read
    DateAxis axis = (DateAxis) plot.getDomainAxis();
    axis.setAutoRange(true);

 //axis.getDefaultAutoRange();
    axis.setDateFormatOverride(new SimpleDateFormat("HH:mm"));

    try {

        ChartUtilities.saveChartAsJPEG(new File("suc.jpg"), 1.0f, chart0, 990, 700);
    } catch (IOException e) {
        e.printStackTrace();
    }

    return chart0;
}
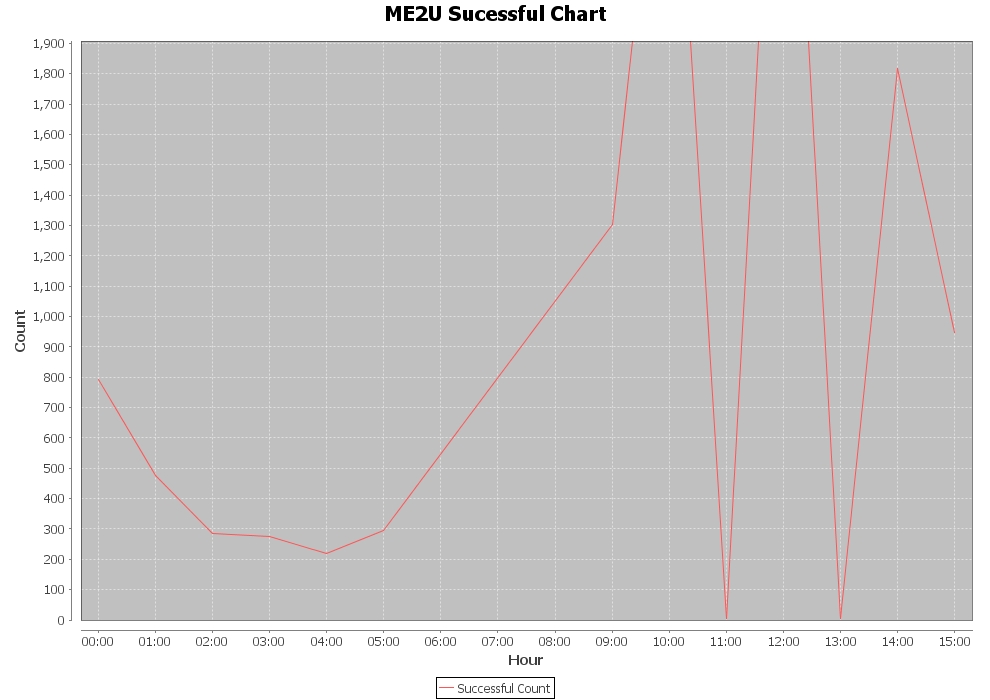
Ниже приведено изображение, которое создается, ясно видно, что ось Y показывает перекрытие.