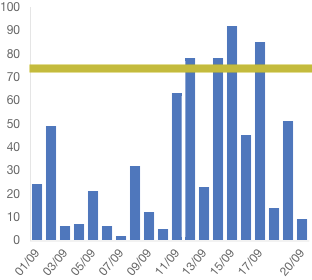
Gráfico Js V2 desenhar barra horizontal (média) sobre barra vertical
Quero desenhar uma única barra sobre as barras verticais (barra verde). Estou usando o Chart JS V2 com Angular 4.
Encontrei algum código para desenhar linhas, mas não está funcionando no Angular 4.
Eu também tentei usarannotation mas não está funcionando. Comando para adicionar anotação:npm install chartjs-plugin-annotation --save
Abaixo está o meu código, funciona bem para desenhar apenas barras verticais. Alguém pode me ajudar a desenhar uma linha horizontal sobre ela.
Responda:
Instalarnpm install chartjs-plugin-annotation --save
Entãoimport 'chartjs-plugin-annotation';
this.ctx = document.getElementById("myChart");
    this.myChart = new Chart(this.ctx, {
        type: 'bar',
        data: {
            labels: this.barData.getLabels(),
            datasets: [{
                label: this.barData.actualLegendLabel,
                data: this.barData.getLineData(),
                backgroundColor: this.backgroundColorBarOne,
                borderColor: [
                    'rgba(81,117, 194,1)',
                ]}]
        },
        options: {
            scales: {
                responsive: true,
                scaleBeginAtZero: false,
                barBeginAtOrigin: true,
                yAxes: [{
                    ticks: {
                        beginAtZero: true
                    },
                    gridLines: {
                        display: false
                    }
                }],
                xAxes: [{
                    ticks: {
                        beginAtZero: true
                    },
                    gridLines: {
                        display: false
                    }
                }]
            },
            legend: {
                cursor: "line",
                position: 'top',
                labels: {
                    fontSize: 10,
                }
            },
            layout: {
                padding: {
                    left: 3,
                    right: 3,
                    top: 5,
                    bottom: 5
                }
            }, annotation: {
                annotations: [{
                    drawTime: 'afterDraw', // overrides annotation.drawTime if set
                    id: 'a-line-1', // optional
                    type: 'line',
                    mode: 'horizontal',
                    scaleID: 'y-axis-0',
                    value: '25',
                    borderColor: 'red',
                    borderWidth: 2,
                    // Fires when the user clicks this annotation on the chart
                    // (be sure to enable the event in the events array below).
                    onClick: function(e) {
                        // `this` is bound to the annotation element
                    }
                }]
            }
        }
    });