Barra de colores arbitraria
Tengo datos que están en el rango -70,0 que visualizo usando imshow () y me gustaría usar una barra de colores no lineal para representar los datos, ya que tengo patrones en el rango -70, -60 y -70, 0 rango. Me gustaría la forma más fácil de reescalar / renormalizar usando una función arbitraria (ver ejemplo) la barra de colores para que todos los patrones se vean bien.
Aquí hay un ejemplo de datos y funciones:
sample_data=(np.ones((20,20))*np.linspace(0,1,20)**3)*70-70
def renorm(value):
"""
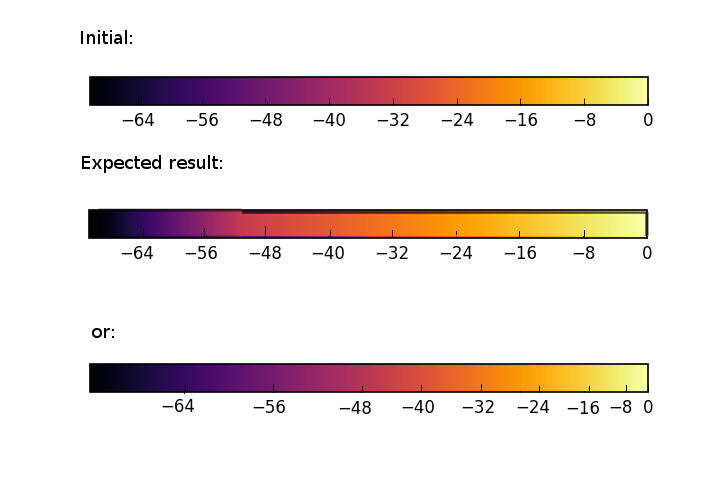
Example of the way I would like to adjust the colorbar but it might as well be an arbitrary function
Returns a number between 0 and 1 that would correspond to the color wanted on the original colorbar
For the cmap 'inferno' 0 would be the dark purple, 0.5 the purplish orange and 1 the light yellow
"""
return np.log(value+70+1)/np.log(70+1)