El punto de serie del gráfico agregado no se sincroniza con el eje X
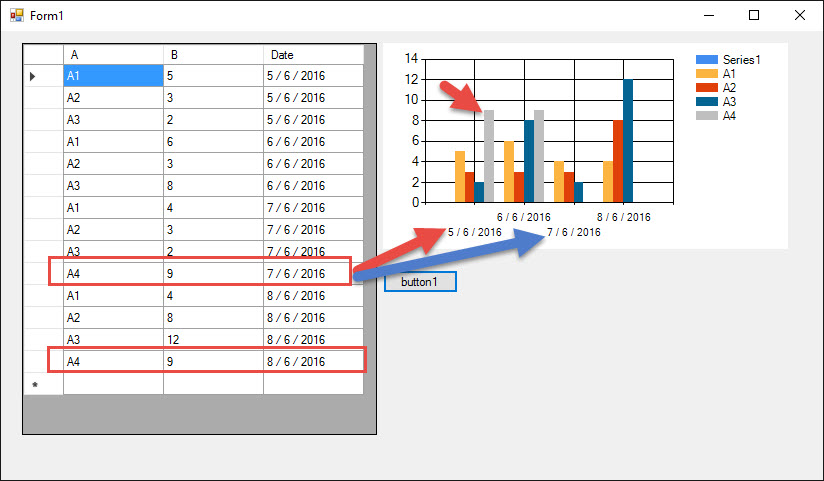
Intento dibujar el gráfico a través de C # con la tabla como imagen. Sin embargo, como puede ver los datos A4 en la fecha: 7 y 8/6 deben permanecer con el mismo 7 y 8/6 X-Axis, anormal aquí todos ellos dejaron 5 y 6/6 X-Axis. ¿Podrías ayudarme a arreglarlo?
for (int i = 0; i < 14; i++)
        {
            string productname = dataGridView1.Rows[i].Cells[0].Value.ToString();
            string datetime = dataGridView1.Rows[i].Cells[2].Value.ToString();
            int para = Convert.ToInt16(dataGridView1.Rows[i].Cells[1].Value);
            if (chart_dashboard.Series.IndexOf(productname) != -1)
            {
                chart_dashboard.Series[productname].Points.AddXY(datetime, para);
                chart_dashboard.ChartAreas[0].AxisX.Interval = 1;
            }
            else
            {
                chart_dashboard.Series.Add(productname);
                chart_dashboard.Series[productname].Points.AddXY(datetime, para);
                chart_dashboard.ChartAreas[0].AxisX.Interval = 1;
            }
        }